Trace LiveKit Agents with Langfuse
This guide shows you how to integrate Langfuse with LiveKit Agents for observability and tracing of real-time voice AI applications. By following these steps, you’ll be able to monitor, debug, and evaluate your LiveKit agents in the Langfuse dashboard.
What is LiveKit Agents? LiveKit Agents (GitHub) is an open-source Python and Node.js framework for building production-grade multimodal and voice AI agents. It provides a complete set of tools and abstractions for feeding realtime media through AI pipelines, supporting both high-performance STT-LLM-TTS voice pipelines and speech-to-speech models with any AI provider.
What is Langfuse? Langfuse is an open-source LLM engineering platform. It offers tracing and monitoring capabilities for AI applications. Langfuse helps developers debug, analyze, and optimize their AI systems by providing detailed insights and integrating with a wide array of tools and frameworks through native integrations, OpenTelemetry, and dedicated SDKs.
Get Started
LiveKit Agents includes built-in OpenTelemetry support. The Langfuse Python SDK can register as an OpenTelemetry span exporter, so all you need is to create a TracerProvider, hand it to both LiveKit and Langfuse, and traces will appear in your Langfuse dashboard automatically.
Step 1: Install Dependencies
pip install langfuse livekit-agents livekit-plugins-openai livekit-plugins-silero livekit-plugins-turn-detector opentelemetry-sdk python-dotenvStep 2: Configure Langfuse SDK
Set up your Langfuse API keys. You can get these keys by signing up for a free Langfuse Cloud account or by self-hosting Langfuse.
LANGFUSE_SECRET_KEY = "sk-lf-..."
LANGFUSE_PUBLIC_KEY = "pk-lf-..."
LANGFUSE_BASE_URL = "https://cloud.langfuse.com" # 🇪🇺 EU region
# LANGFUSE_BASE_URL = "https://us.cloud.langfuse.com" # 🇺🇸 US region
Step 3: Set Up the Langfuse Tracer Provider
Create a shared TracerProvider and pass it to both LiveKit (via set_tracer_provider) and the Langfuse SDK. The Langfuse SDK automatically registers an exporter on the provider to send spans to Langfuse.
Because LiveKit generates many internal spans, set should_export_span=lambda span: True so that all telemetry is forwarded.
import os

from langfuse import Langfuse
from opentelemetry.sdk.trace import TracerProvider
from opentelemetry.util.types import AttributeValue

from livekit.agents.telemetry import set_tracer_provider


def setup_langfuse(
    metadata: dict[str, AttributeValue] | None = None,
    *,
    host: str | None = None,
    public_key: str | None = None,
    secret_key: str | None = None,
) -> TracerProvider:
    public_key = public_key or os.getenv("LANGFUSE_PUBLIC_KEY")
    secret_key = secret_key or os.getenv("LANGFUSE_SECRET_KEY")
    host = host or os.getenv("LANGFUSE_HOST") or os.getenv("LANGFUSE_BASE_URL")

    if not public_key or not secret_key or not host:
        raise ValueError(
            "LANGFUSE_PUBLIC_KEY, LANGFUSE_SECRET_KEY, and LANGFUSE_HOST (or LANGFUSE_BASE_URL) must be set"
        )

    trace_provider = TracerProvider()
    set_tracer_provider(trace_provider, metadata=metadata)

    Langfuse(
        public_key=public_key,
        secret_key=secret_key,
        base_url=host,
        tracer_provider=trace_provider,
        should_export_span=lambda span: True,
    )

    return trace_provider
Step 4: Use the Tracer Provider in Your Entrypoint
Call setup_langfuse() before AgentSession.start(). You can pass optional metadata (such as langfuse.session.id) that will be attached to every span.
from livekit.agents import AgentSession, JobContext, metrics
from livekit.agents.voice import MetricsCollectedEvent
from livekit.plugins import silero


async def entrypoint(ctx: JobContext):
    trace_provider = setup_langfuse(
        metadata={
            "langfuse.session.id": ctx.room.name,
        }
    )

    async def flush_trace():
        trace_provider.force_flush()

    ctx.add_shutdown_callback(flush_trace)

    session = AgentSession(vad=silero.VAD.load())

    @session.on("metrics_collected")
    def _on_metrics_collected(ev: MetricsCollectedEvent):
        metrics.log_metrics(ev.metrics)

    await session.start(agent=MyAgent(), room=ctx.room)
You can find a full end-to-end example on GitHub.
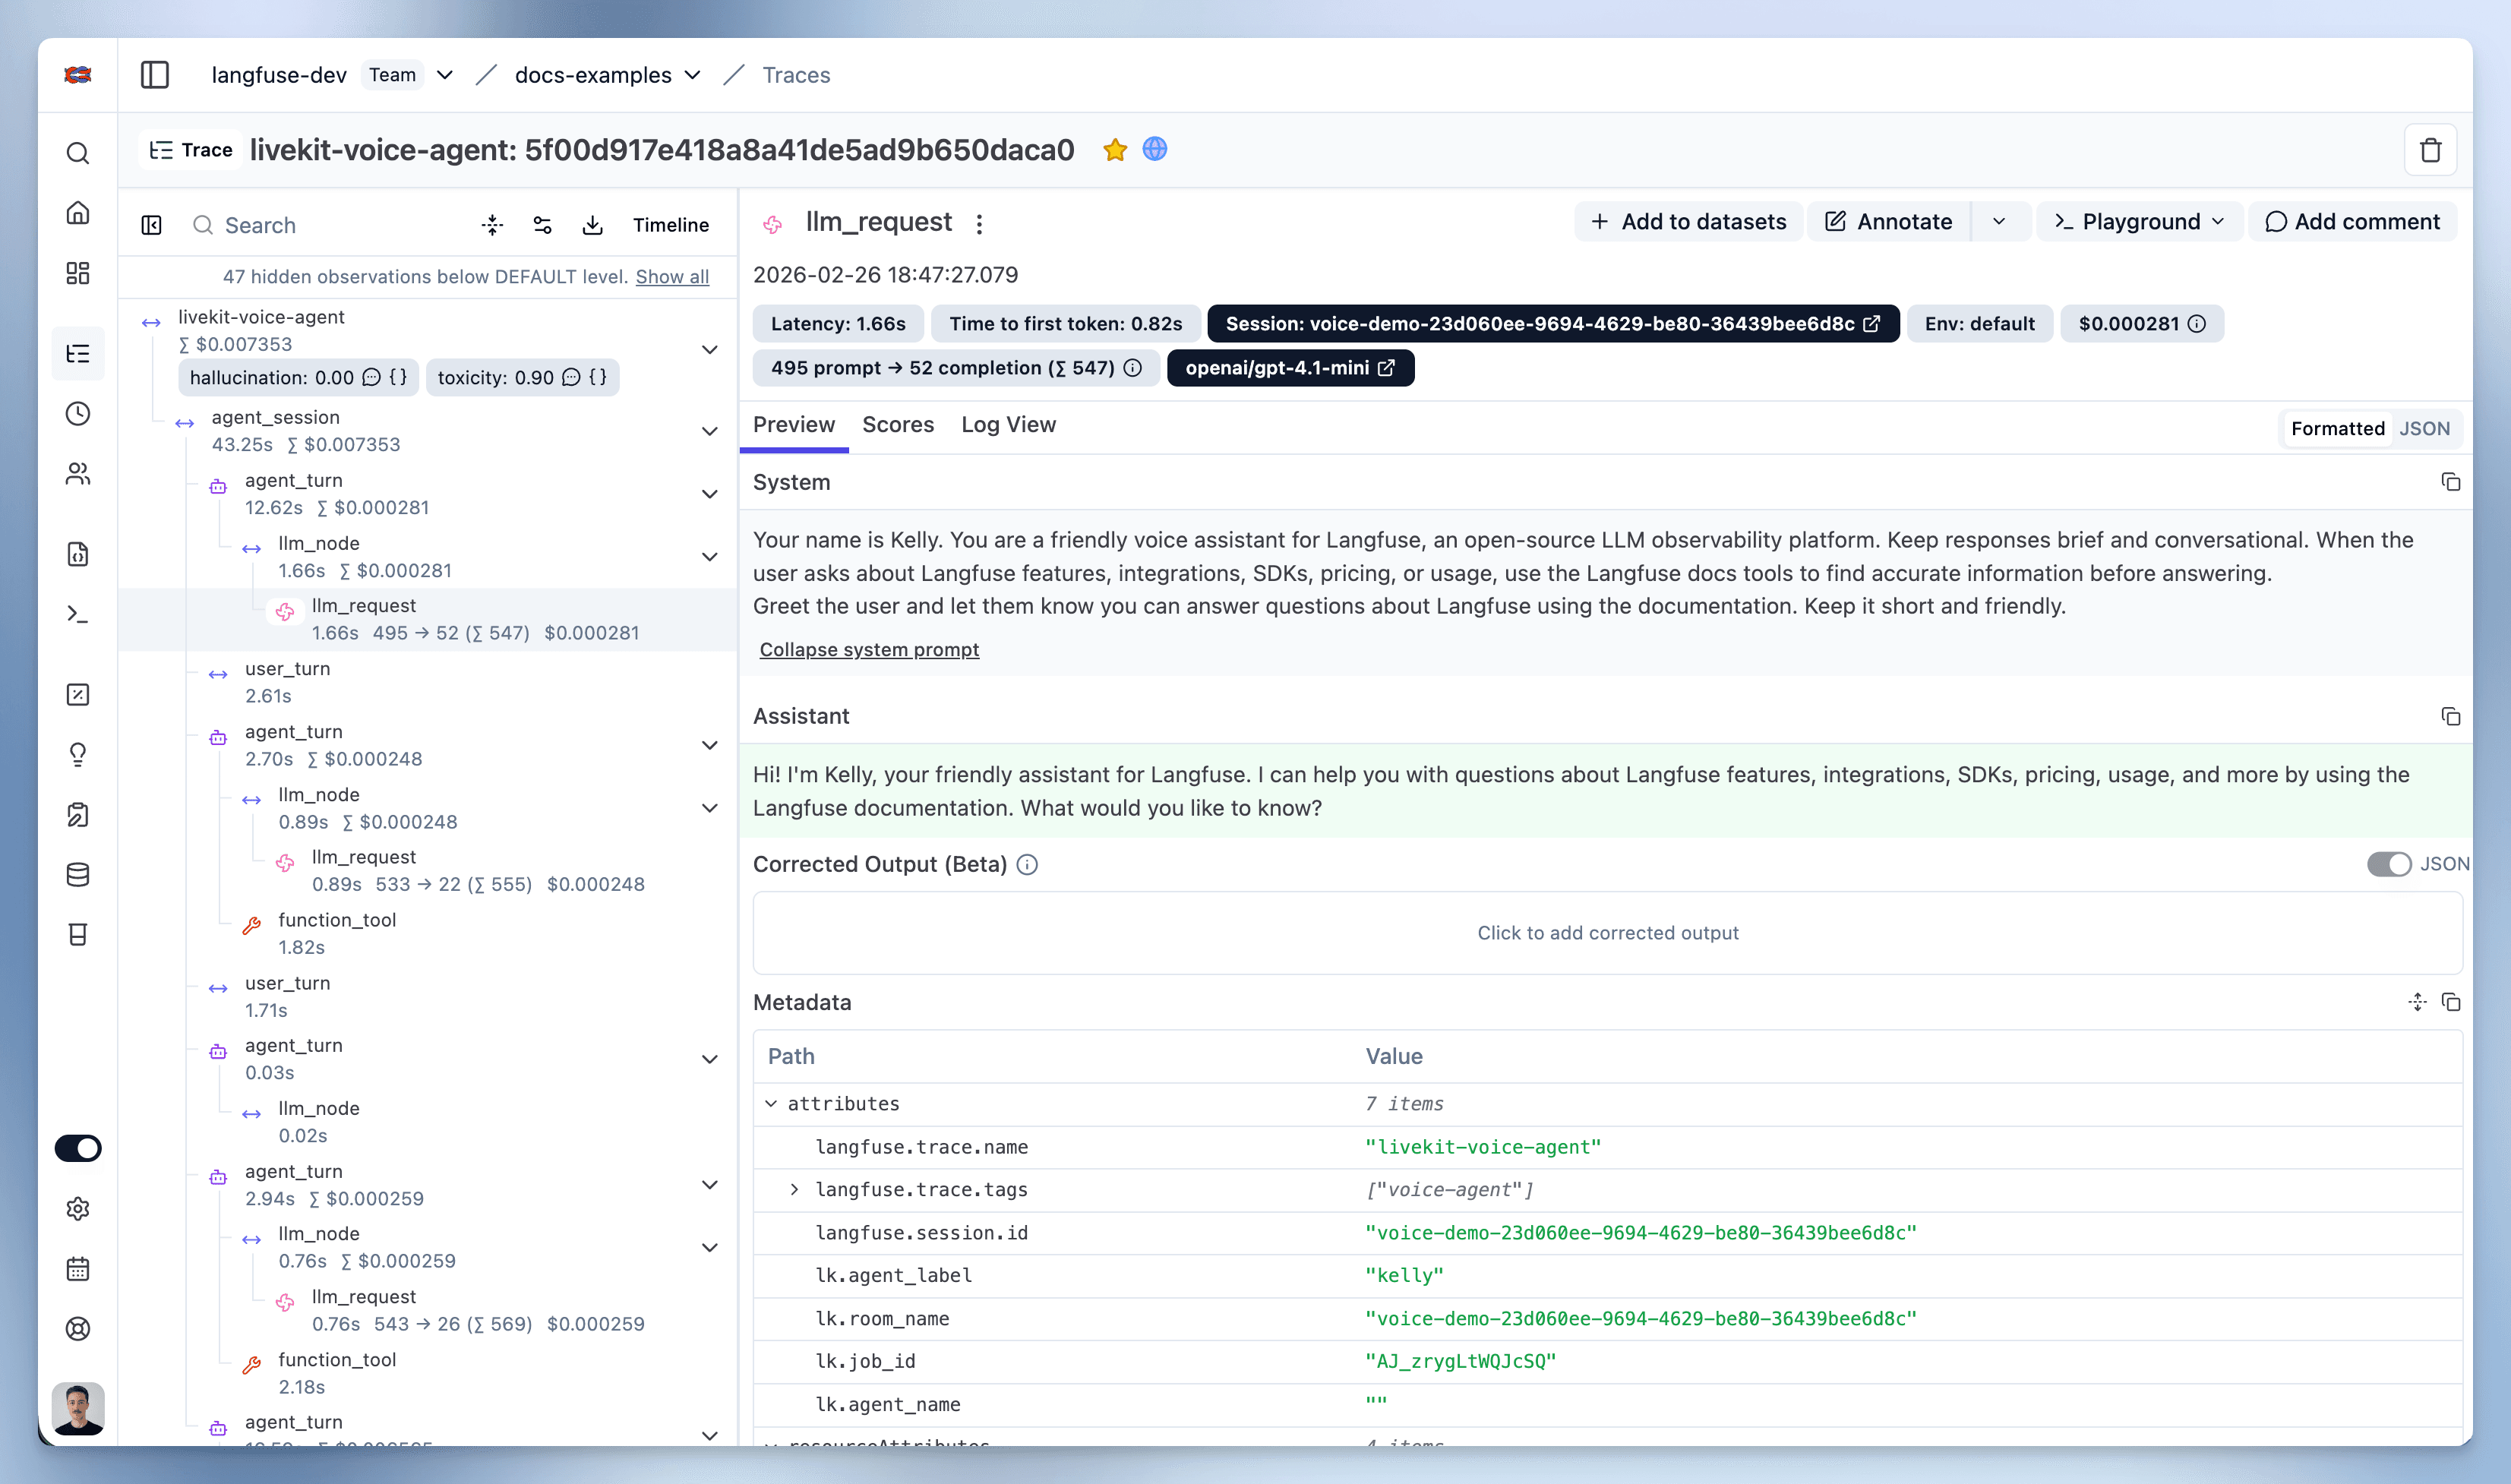
Step 5: View Traces in Langfuse
After running the agent, navigate to your Langfuse Trace Table. You will find detailed traces of the agent’s execution, providing insights into every agent step, tool call, input, output, and performance metric.
Interoperability with the Python SDK
You can use this integration together with the Langfuse SDKs to add additional attributes to the observation.
The @observe() decorator provides a convenient way to automatically wrap your instrumented code and add additional attributes to the observation.
from langfuse import observe, propagate_attributes, get_client

langfuse = get_client()

@observe()
def my_llm_pipeline(input):
    # Add additional attributes (user_id, session_id, metadata, version, tags) to all spans created within this execution scope
    with propagate_attributes(
        user_id="user_123",
        session_id="session_abc",
        tags=["agent", "my-observation"],
        metadata={"email": "user@langfuse.com"},
        version="1.0.0"
    ):

        # YOUR APPLICATION CODE HERE
        result = call_llm(input)

        return result

# Run the function
my_llm_pipeline("Hi")
Learn more about using the Decorator in the Langfuse SDK instrumentation docs.
Troubleshooting
No observations appearing
First, enable debug mode in the Python SDK:
export LANGFUSE_DEBUG="True"Then run your application and check the debug logs:
- OTel observations appear in the logs: Your application is instrumented correctly but observations are not reaching Langfuse. To resolve this:
- Call
langfuse.flush()at the end of your application to ensure all observations are exported. - Verify that you are using the correct API keys and base URL.
- Call
- No OTel spans in the logs: Your application is not instrumented correctly. Make sure the instrumentation runs before your application code.
Unwanted observations in Langfuse
The Langfuse SDK is based on OpenTelemetry. Other libraries in your application may emit OTel spans that are not relevant to you. These still count toward your billable units, so you should filter them out. See Unwanted spans in Langfuse for details.
Missing attributes
Some attributes may be stored in the metadata object of the observation rather than being mapped to the Langfuse data model. If a mapping or integration does not work as expected, please raise an issue on GitHub.
Next Steps
Once you have instrumented your code, you can manage, evaluate and debug your application: